Friday’s U.S. inflation report may not change near-term Fed policy, but its influence on the long end of the Treasury curve could be significant. Here’s why that matters for FX traders and those following broader forex trading strategies, indices trading, and the crypto market.
Fed Focused on Labor Market, Not Inflation
Back-end Treasuries likely to lead post-inflation data reaction
Relative yield curve shifts often drive USD/JPY and USD/CHF
Technicals: USD/JPY bullish, USD/CHF neutral
Summary
Friday’s U.S. inflation report may not sway the Fed’s near-term decisions, but its implications for the long end of the Treasury curve and by extension FX markets are far from trivial. A steepening curve could lift USD/JPY and USD/CHF, while a flattening move may weigh on them. With technical setups favoring near-term upside for USD/JPY and mixed signals for USD/CHF, traders should watch both the data and curve reaction closely. These developments are also being closely tracked by investors diversifying across crypto investment and indices trading for cross-market opportunities.
Inflation Report Not a Nothingburger
It’s widely accepted that Friday’s U.S. inflation report is unlikely to alter the outlook for the Fed funds rate over the remainder of the year, with the message from FOMC officials received loud and clear that it’s the labor market driving policy right now, not inflation. As such, many traders and analysts have written it off as irrelevant in the absence of a major left- or right-tail print.
While the report has little relevance for what the Fed may do next week or even in December where two rate cuts remain close to fully priced it could shape long-term positioning in forex trading strategies. The report will also be observed by participants in the crypto market seeking correlation trends between dollar strength and digital assets.
The Treasury Curve Connection
Longer-dated Treasuries are where the largest yield movements may be found as traders give their verdict on what the report means for the longer-term outlook for growth and inflation.
When it comes to the likely Treasury curve reaction, a hotter-than-expected print especially among services categories may result in a bear steepening, lifting longer-dated yields more than others. Alternatively, a soft print may deliver a bull flattening, with longer-dated yields falling more than shorter-dated.
Such shifts in the yield curve often have ripple effects across global indices trading and crypto investment markets, as traders reposition portfolios in anticipation of U.S. economic momentum and Fed policy direction.
Relative Growth Outlooks Influence FX Markets
When it comes to the shape of sovereign yield curves, they have a reasonable relationship to moves in the dollar against other major currencies, including the Japanese yen and Swiss franc.
In essence, what this measures are shifts in relative nominal economic growth expectations for the United States compared to Japan and Switzerland. Based on the scores over most time periods, there is some relationship with FX, demonstrating a stronger correlation than movements in outright U.S. Treasury yields or yield differentials over the same periods.
Should that remain the case, a steepening of the U.S. curve following the inflation report may lift USD/JPY and USD/CHF, with the opposite true if we see a flatter curve. Traders implementing diversified forex trading strategies may find opportunities in these movements, while crypto market participants watch for potential spillovers into digital asset volatility.
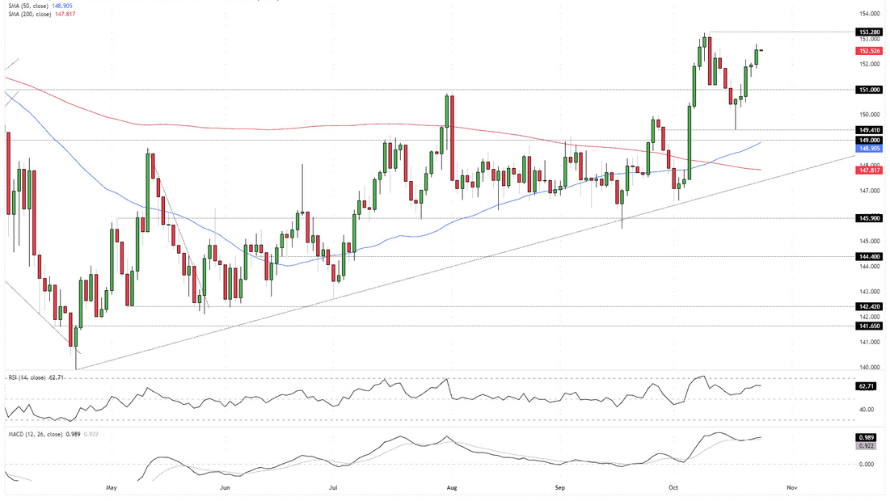
USD/JPY Eyes October Highs
Upside risks flagged in earlier outlooks have materialized nicely for USD/JPY, with the pair breaking above 151.00 resistance before extending the bullish move back towards the October 10 high of 153.28.
With momentum indicators firmly bullish, upside is favored in the near term. RSI (14) is trending higher above 50 but is not yet overbought. MACD has confirmed the bullish signal, crossing over the signal line from below above zero before resuming its push higher. Upside pressure is building.
Should the pair manage to break and hold above 153.28, traders may target a retest of resistance at 154.80. Should 153.28 hold, 151.50, 151.00, 149.41, and 149.00 are support levels of note.
Such patterns are of keen interest to those using advanced forex trading strategies and even indices trading models that react to U.S. yield dynamics and global risk sentiment.
USD/CHF Impacted by Geopolitics
The technical picture for USD/CHF looks quite different compared to USD/JPY despite its relatively tight relationship with shifts in relative growth differentials, likely reflecting recent geopolitical events involving Russia.
On Thursday, the rejection at the 50-day moving average ultimately delivered a shooting star candle, warning of potential downside risks ahead. The move has seen the pair move back to support at .7950, where it currently resides.
With momentum indicators providing a neutral signal even if they marginally favor downside, more emphasis should be put on price action and signals in the current environment.
Should we see a break of .7950, .7912 is another nearby support level, with the October 17 low of .7875 and September 17 low of .7830 other levels of note. Above the 50-day moving average, .8000, June downtrend around .8040, and resistance at .8071 should be on the radar should we see a bounce.
Market participants across forex trading strategies, indices trading, and crypto investment sectors are monitoring these moves closely as part of broader cross-asset correlations that shape global risk sentiment.