Gold printed another lower high and lower low Thursday, with the $4,039 low retesting the 20-day average after early strength found resistance near the 10-day line. In the broader landscape of crypto investment, indices trading, and the crypto market, gold traders are closely watching whether traditional safe-haven flows will strengthen.
Thursday’s Bearish Continuation
Bears maintained control Thursday, generating a lower daily high of $4,110 and low of $4,039 as early buying ran into immediate resistance near the 10-day average. The failed breakout attempt from yesterday repeated, quickly reversing and pushing price back toward the 20-day average for another test a common pattern seen across markets including forex trading and indices trading.
Four-Day Struggle
Since establishing a higher interim swing low at $3,998 on Tuesday setting up potential for a second leg higher from October’s $3,886 base gold has shown almost no upside conviction. Rally attempts repeatedly meet supply and fade, keeping the entire structure fragile. This lack of momentum mirrors sentiment seen across the crypto market and in certain crypto investment sectors.
Critical Support Levels
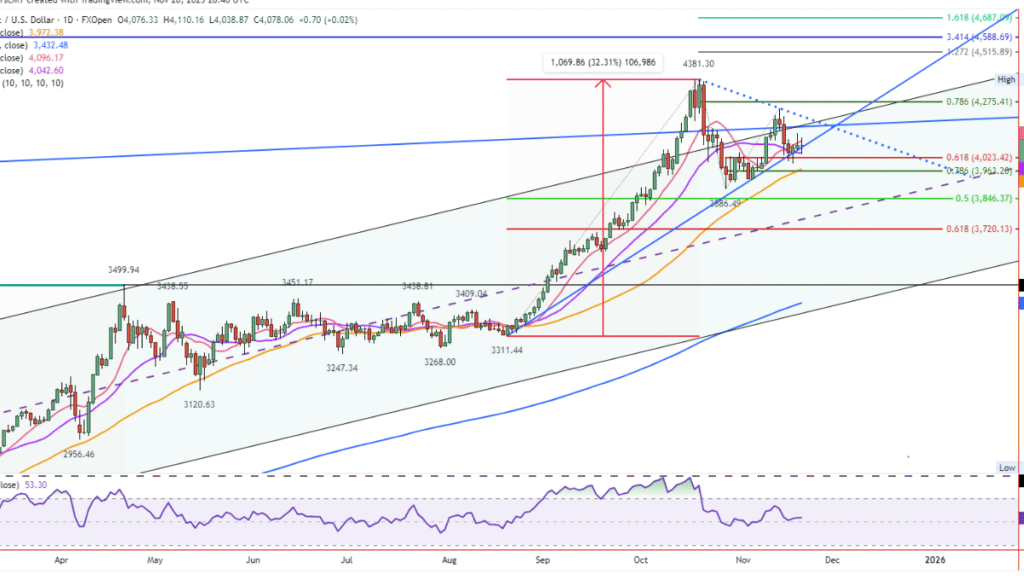
The $3,998 low remains the immediate bull-bear pivot. A decisive drop below confirms failure of both the 20-day average and 61.8% Fibonacci retracement near $4,023, targeting the rising 50-day average at $3,975 aligned with the 78.6% retracement at $3,963.
Deeper Objectives
Should that confluence crack, the October $3,886 swing low enters focus, followed by the 50% retracement of the August–October upswing at $3,846. Until proven otherwise, the broader pattern retains an upward bias as long as the trendline/20-day zone holds as a dynamic support zone. Traders monitoring forex trading strategies may see similar trend-based opportunities.
Bullish Reversal Trigger
An advance and close above Thursday’s $4,110 high would create a one-day bullish reversal off key support. Quick follow-through above Wednesday’s $4,133, then the $4,245 lower swing high, would restore buyer momentum. Otherwise, a period of consolidation could unfold, similar to what is seen during sideways phases in the crypto market.
Weekly Shooting Star Context
The weekly chart is forming an inside week in the lower half of last week’s $3,997–$4,245 range, which ended with a potential shooting star and lower swing high. A decisive break below last week’s $3,997 low triggers the bearish weekly candle.